Visualizing US Net Immigration By President | ZeroHedge

Ahead of the U.S. presidential election, immigration policies are top of mind for American voters. But how has immigration to the U.S. looked over the past two decades across both Republican and Democratic presidencies?
This chart, via Visual Capitalist's Kayla Zhu, shows net immigration figures in the U.S. from 2001 to 2024, broken down by immigrant status. Data for 2021 to 2024 are projections.
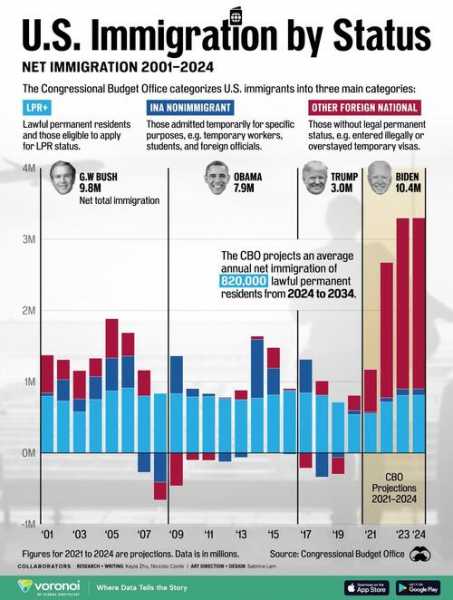
The figures come from a report authored by the Congressional Budget Office (more…)


 Bitcoin
  Ethereum
  Tether
  Stellar
  Litecoin
  VeChain
  Maker
Maker  Zcash
Zcash  NEO
NEO  Decred
  0x Protocol
  Ontology
  OMG Network