
In 2023, solar energy accounted for three-quarters of renewable capacity additions worldwide. Most of this growth occurred in Asia, the EU, and the U.S., continuing a trend observed over the past decade.
In this graphic, Visual Capitalist's Bruno Venditti illustrates the rise in installed solar photovoltaic (PV) capacity in China, the EU, and the U.S. between 2010 and 2022, measured in gigawatts (GW). Bruegel compiled the data..
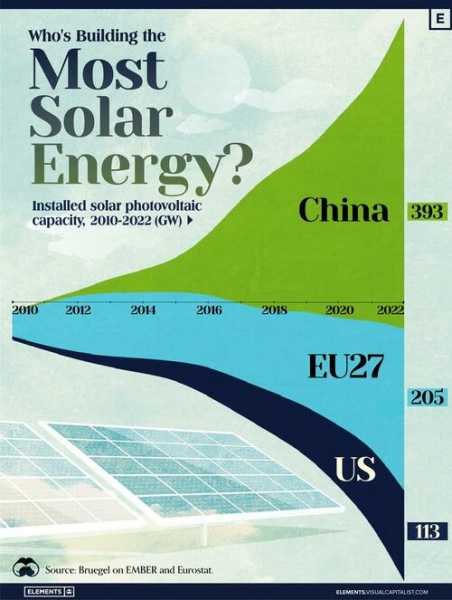
Chinese Dominance
As of 2022, China’s total installed capacity stands at 393 GW, nearly double that of the EU’s 205 GW and surpassing the USA’s total of 113 GW by more than threefold in absolute terms.

Since 2017, China has shown a compound (more…)

 Bitcoin
  Ethereum
  Tether
  Stellar
  Litecoin
  VeChain
  Maker
Maker  Zcash
Zcash  NEO
NEO  Decred
  0x Protocol
  Ontology
  OMG Network