More High-Profile Retail Stores Are Getting Kicked In The Teeth | ZeroHedge

Authored by Mark Gilman via The Epoch Times (emphasis ours),
Lackluster consumer confidence is negatively affecting discount retailers such as Dollar General and Big Lots. Dollar General’s shares dropped 32 percent on Aug. 29 after the company admitted in its earnings report that lower-income customers are still struggling, while Big Lots’s fortunes are in a tailspin.
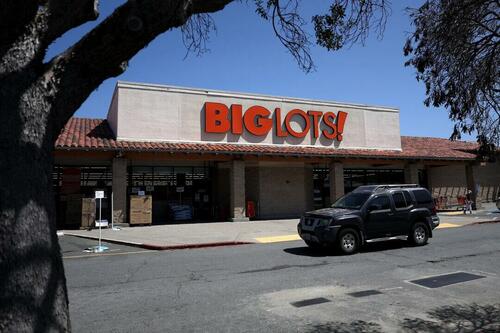
A sign is posted in front of a Big Lots in Hercules, Calif., store on June 7, 2024. Justin Sullivan/Getty (more…)

 Bitcoin
  Ethereum
  Tether
  Stellar
  Litecoin
  VeChain
  Maker
Maker  Zcash
Zcash  NEO
NEO  Decred
  0x Protocol
  Ontology
  OMG Network